

Our CML (Central Monitoring Logs) system continuously collects data from all servers and other devices on our network and evaluates it in real time. This is 600 – 700 GB of data per day. It serves primarily for the purpose of tracking down errors and problems. However, we also use them for our protection, for example. But what if we made them into an infographic?
What data is used
The following data is compiled from 521,314,847 pages generated in the 1-week period from Sunday 12.04.2020 to Saturday 18.04.2020 on NoLimit (old and new servers) and WMS. Just for the record, the total traffic during this time was 2,001,258,362 requests.
This is an average of about 862 pages generated per second. Significantly less at night, significantly more during the day. But that’s not all. Today, below you will learn a few more interesting facts…
For example, over half of the requests are blocked, so they are not displayed to the end bot (or attacker) and are not included in the statistics below. Each page is made up of different parts and we also log them. Thus, we log on average tens of thousands of records every second. It is much more at peak times and less at night.
How fast is the WEDOS site?
Sometimes it is said somewhere that our websites are slow. When someone solves this with us, we usually find out that they don’t have the caching set up correctly, a third party element is preventing the page from rendering, or they are using some extension that communicates with the third party and it is slow.
So what is the average for all pages in WEDOS, whether it is a cached php page, a script that parses data or a search in the e-shop?
The time in the graphic is in ms and indicates how long it took the server to provide the content to the visitor. In reality, it is necessary to add a few ms for communication within the Czech Republic and Slovakia or a few tens of ms for communication within Europe.
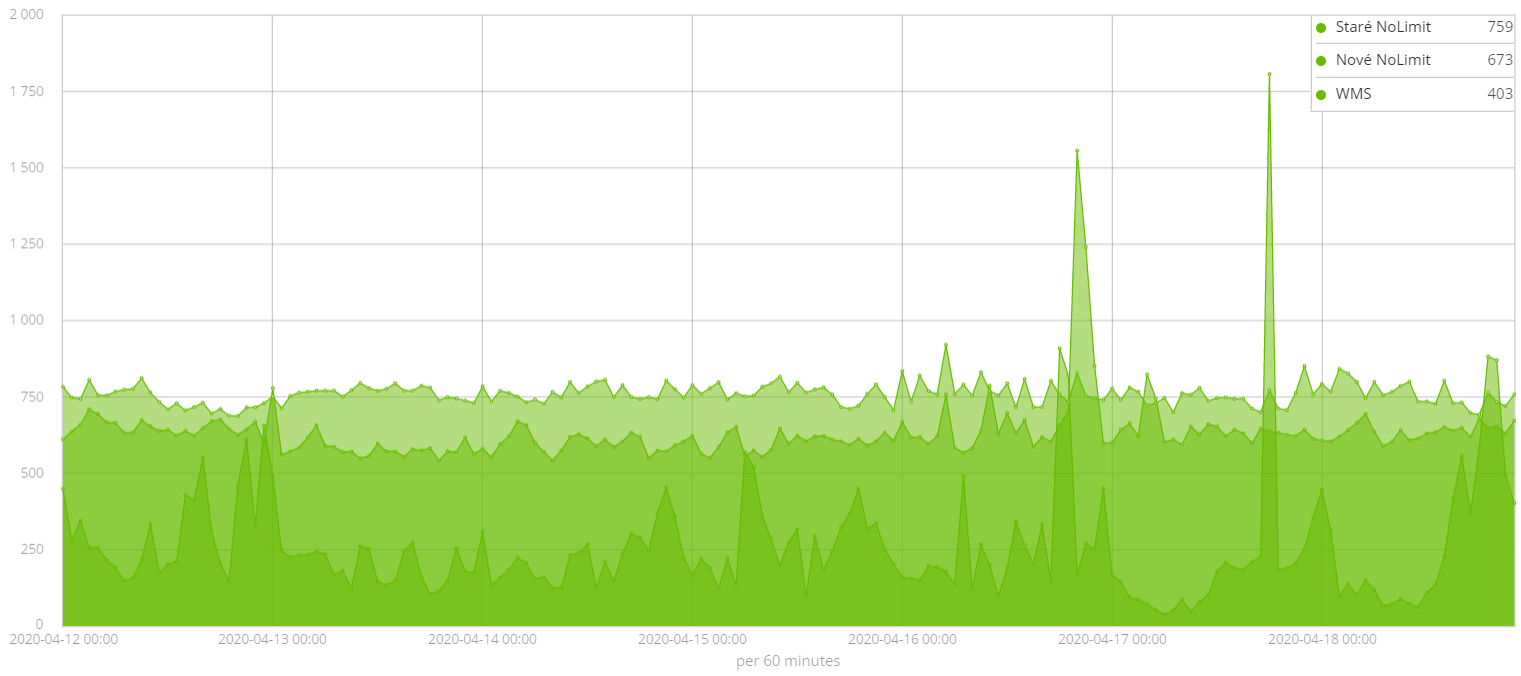
Average page generated by the server

As you can see, the pages on older NoLimit servers are on average 759 ms slower because they use weaker processors for the webserver and database and server SSDs.
The new NoLimit, already running in the cloud on HPE Moonshot, is about 11.3% faster. The 7-day average is 673 ms. Your scripts have 3.8 GHz processors and very fast NVMe SSDs.
There are only dozens of customers on the WMS so far, so the data is very skewed. The WMS always has dedicated hardware power so there is not as much interference from other users. Even so, the average is 403 ms.
Median server page generation

However, the average page speed on web hosting is like the average salary. A few people have a lot more than others and then it seems like everyone has a lot on average 🙂
The median, i.e. the true middle value, reveals much more.
Median looks different now. It is enough to have a non-optimized editorial system and the average goes up quickly. Scripts that customers call regularly via CRONs also consume tens of seconds, for example, automatic backups, data import/export or maintenance can take minutes.
You can see that in this graphic. Surprisingly, the median site is faster on the old NoLimit(107 ms) than on the new NoLimit(208 ms). How is that possible? The legacy NoLimit customers are mostly more experienced customers who either don’t use content management systems, have their own customized solutions, or have yet to install content management systems manually themselves. They know how to optimize them, and as a result they can achieve higher speeds even with slower processors.
If we look at a 7 day chart with the median for new Nolimits, we see spikes when there is a spike in traffic. Overall, however, the chart is rather balanced. The new NoLimit are very oversized and they are helped by proxy servers (see below).

On the other hand, on older servers we see similar traffic every day. More experienced users perform nightly maintenance, backups, data imports and other labor-intensive procedures. During the day, the traffic follows the normal interest of people in the site. In addition, the older NoLimit is no longer adding new customers.

Proxy servers
The new NoLimit and WMS have proxy servers they can use. These proxy servers can handle requests very quickly because they store the generated page and then serve it directly to customers. It is therefore not necessary to re-generate them on the server. However, most customers use proxy servers indirectly through extensions for their content management systems.
The following graph shows how long it takes on average for a proxy server to handle a page request. The average includes both the waiting time for the first generation and the saved page.

Rather, the median tells you how much speed the proxy can provide. 208 ms sever vs 148 ms proxy, that’s almost 29% faster.
 Customers who know how to use our proxy server have pages generated really fast, but in truth something is still missing…
We are now working on Proxy v2.0, which will be built on NGINX and will be anycast with points around the world. There, the goal is to return pages at the speed of a blink of an eye (under 100 ms) and anywhere in the world 😉
The biggest sites on NoLimit and WMS
NoLimit was already an oversized webhost at the time of launch. While most of the competing offers failed to get WordPress up and running properly in 2011 due to the parameters, NoLimit offered ideal parameters for 15 CZK/month (we had introductory prices when we launched WEDOS).
Thanks to content management systems like WordPress, we’ve grown up with them and they are a priority for us now and in the future. We keep an eye on how they work and whether they can handle the often huge traffic. We have trained CMS specialists with years of experience to help with content management systems, optimizing our services and customizing our CMS protection settings. We’re not afraid to dig into the settings and increase the parameters so that NoLimit is still the best choice for popular editorial systems.
But how much does NoLimit actually pull in, if the sites are taken care of by professionals who CAN 😉
The following graph shows the top 20 websites on NoLimit by number of impressions over 7 days.

Yes, the record holder has 30,887,648 views per week, i.e. 4,412,521 per day or 183,855 per hour, so in total it makes 5.93% of all weekly views of all sites. And yes it runs on NoLimit, it just has the Extra service 🙂
Others have left us a little behind, so let’s look at the same graph with a logarithmic scale.

As you can see, in order to get into the top 20 on WEDOS NoLimit or WMS, you have to exceed 700 thousand impressions per week. But be careful .html pages, documents and multimedia are not included 😉
With the exception of one site, which is on WMS, they are all on NoLimit. Some don’t even have extras. It’s probably not surprising that most of them are on WordPress. So don’t believe that WordPress is just for small personal sites 🙂
By the way, all of our company WEDOS websites run on WordPress. Even in our country, one of the leading Czech e-shops with a turnover of about a billion is on NoLimit and it also runs on WordPress.
So the next time someone asks you if NoLimit can handle 10,000 visits, you can tell them, “If you know how to optimize websites, you can do it several times in an hour” 😉
What was attacked this week
Of course, it would never be possible to run such large sites on our NoLimit if we didn’t protect all of them from attacks. Attackers, robots collecting marketing data and a lot of other things create an incredible amount of burden. More than half of all traffic today is already “junk”, which when filtered out nobody misses.
Without protections, every website would be visited by hundreds to thousands of robots and automated scripts per day. That’s an incredible burden.
Over time, we have built a robust series of protections that protect our customers’ sites in a variety of ways. The biggest and most costly is DDoS protection. Over the years, we’ve refined and improved it so much that we sometimes forget we have it, even when a 44.5 Gbps attack is coming at us.
Behind it is very fast filtering based on blacklists, greylists and whitelists. It draws data from the CML. If an IP address behaves suspiciously, it gets banned. This protection is constantly being extended and its contribution to blocking faulty traffic is growing.
This filtering changes dynamically in response to current threats. We’ll just slow someone down, block someone else. Someone for a few seconds, another for minutes and another for hours, and some “robbers” permanently. Everything runs automatically and continuously and every minute it evaluates the data and changes the rules accordingly.
And then there’s IPS/IDS protection. It already directly filters unencrypted (HTTP) traffic. It consists of more than 20 thousand rules and serves as the last barricade. He can recognize a general and specific attack and stop it. We also use data from public and private databases of known vulnerabilities. Unfortunately it does not protect HTTPS traffic, which will be solved by Proxy v2.0.
And what was the most attacked this week? According to forward filtering and IPS/IDS data, this was the main site. That’s where we block the most.

For the sake of clarity, let’s take another look at the graph with a logarithmic scale.

As you can see in the graph, most of the attacks are directed at WordPress. These are very well-known security holes that are massively exploited. However, you won’t find the most dangerous attacks in any of the charts above. The attackers make sure they’re not too visible. It can spread an attack across time and servers. It attacks, for example, once every 7 minutes on 1 website on 1 IP address. We see this because we download all the data to one place from all the servers.
Conclusion
From the huge amount of data we see a lot of interesting information. And this is how we are gradually analyzing and using it not only to protect ourselves from attackers, but we want to help our clients not to get scammed by advertising networks… You won’t believe that up to over 90% of all online ads are actually completely ineffective robot casts and clicks or mistakes. And if you pay for online advertising, in many cases you are just throwing money out the window – our own experience. But more on that next time.
So what do you think of our first annotated infographic? If you like it, we can prepare another, more detailed and not only about the sites at WEDOS. For example, we have a large enough sample (almost 20% of .cz domains) to show you how the Czech Internet is doing 🙂
Only web hosts and WMS are in the infographic. There are no dedicated or virtual servers or other services.
Or would you prefer something darker? Backdoors, DDoS attacks, 0-day exploits 😉